
The NSW Selective High Schools Placement Test (SHSPT) is an important part of your child’s educational journey and one that can cause both parents and students a lot of stress and worry.
You’ve likely heard that the SHSPT scores are standardised or moderated, or that the marks of other children at your child’s school can have an impact on your child’s overall score.
So how does that work?
Is it fair?
What do they do to your child’s score?
The standardising, moderating or scaling of marks is a complicated process and not easy for many parents – or students – to understand.
High-level mathematics and statistical functions are used to adjust student scores, and because that mathematics is too complicated for most of us to understand, it can feel like something suspicious and unfair might be happening.
But actually, standardisation is the best way we have of ensuring all students are compared fairly, across the state.
Each year, selective schools want to enrol the best students from across the State. But that’s hard to determine, because:
Therefore, to be able to more fairly incorporate school assessments from across the State, some statistical mathematics is used. It helps even up the playing field, which is better for everyone.
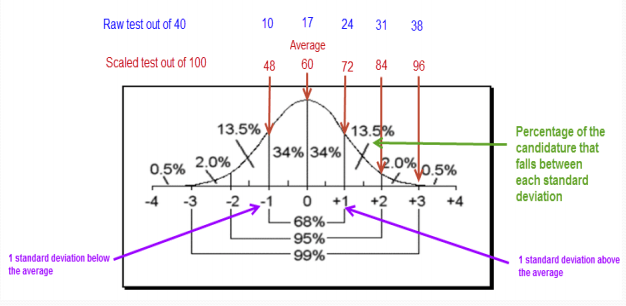
Image provided by Education NSW
We would expect to see a similar performance pattern in students’ SHSPT scores to that seen in their school assessments. The student scoring best in his or her school assessment is also likely to be the top-performing child from that school in the SHSPT.
By comparing the SHSPT score of the children from the same school, and then comparing the overall performance of children from each school against the performance of ALL candidates sitting the test, a better picture of the accuracy of the assessments from schools is created.
For instance, if a school assessment showed scores between 90-100 for each child (indicating high performing students), but those children’s SHSPT scores ranked them in the middle of the group (indicating average performing students), there’s a problem.
We can assume the school’s assessment scores are overly generous. They will be adjusted to better reflect being in the centre of the entire group of candidates, taking into account where each child ranks within against other students from their school.
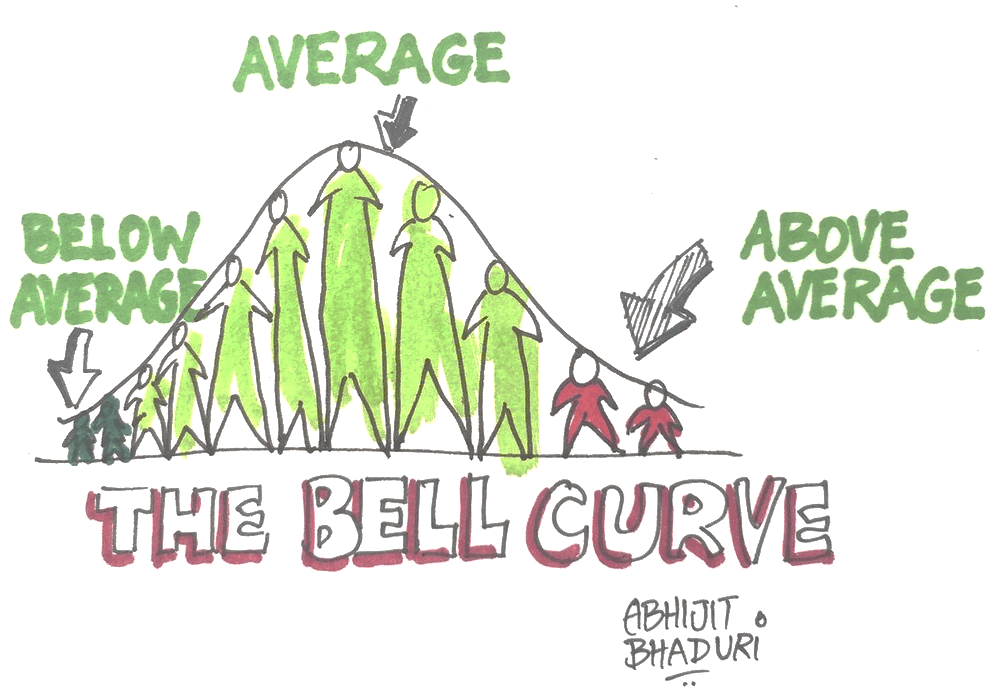
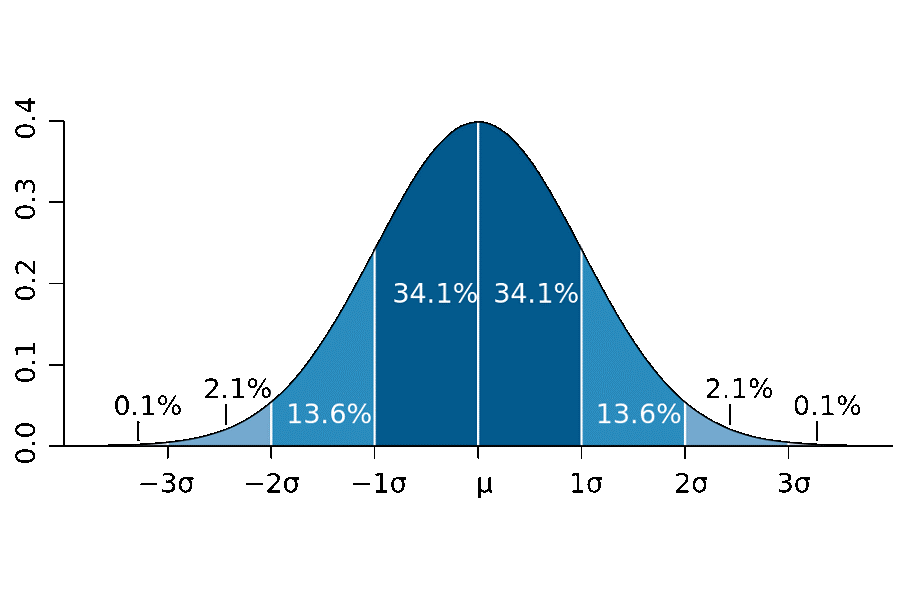
Scaling is when test scores are treated with some statistical mathematics that allows all student results to be plotted to what’s known as a “bell curve”. This is a very common form of graphically representing results. It recognises that most students will score within the same range, which is reflected in the centre of the graph, and fewer students will score very high or very low scores.
Scaling allows those analysing the results to better understand how a student performs in comparison to the group. It helps to determine whether a student is average, low performing or high performing. For instance, a student may have a raw score of 75/100 and we could assume this student did OK, but not brilliantly.
However, if most of the students scored between 40/100 and 55/100, then the score of 75/100 is exceptionally good. This is a very high performing student. But if most students scored between 85/100 and 95/100, the bell curve will indicate that the student scoring 75/100 is performing poorly. This process allows those assessing the results to more clearly identify the outstanding students versus the average students, and to better recognise what constitutes true academic excellence within a given group of students.
It can seem like a big part of your child’s success may lie in the hands of these statistical adjustments. But the process is applied to all candidates sitting the test and should not disadvantage your child at all. It will provide you with insight into how your child is performing compared to their entire year level, across the State. And, you may find it delivers a pleasant surprise.
If your child has teachers who are “hard markers” or “tough”, their school grades may not accurately reflect your child’s ranking against others across the State. Standardisation will address this and you may find your child is ranked higher, compared with their peers, than you expected.
If you’re concerned about your child’s performance in the SHSPT, or have any questions, visit our website www.globaleducationacademy.com.au or Call us to find out more 1300 001 432.
Not sure about your child’s potential? Book an assessment now